CAGR Calculator — Compound Annual Growth Rate Calculator | AliGreat.com
Free CAGR Calculator for India — find the compound annual growth rate between a starting and ending investment value in seconds.
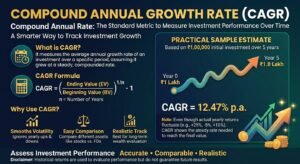
When someone says a mutual fund “returned 15% a year,” what they usually mean is CAGR — Compound Annual Growth Rate — the single, smoothed-out yearly rate that would take a starting value to an ending value over a given period, as if growth had happened at a perfectly steady pace every single year. It’s the standard way finance professionals compare investments fairly across different time periods, and the CAGR Calculator on AliGreat.com works it out instantly from just three numbers.
What does the CAGR Calculator do?
Enter your starting investment value, the ending value, and the number of years between the two. The calculator instantly shows the CAGR as a percentage, the absolute (non-annualised) return over the whole period, and the absolute rupee gain — all three together give a fuller picture than any single number alone would.
The formula behind it
CAGR is calculated as:
CAGR = (Ending Value / Beginning Value)^(1/n) − 1
where n is the number of years. This formula effectively finds the single steady annual growth rate that, if compounded every year, would turn your starting amount into your ending amount — smoothing out whatever specific ups and downs actually happened along the way.
A worked example
Suppose you invested ₹1,00,000 in a fund five years ago, and it’s worth ₹2,50,000 today.
CAGR = (2,50,000 / 1,00,000)^(1/5) − 1 = (2.5)^0.2 − 1 ≈ 20.1%
This means your investment grew at an effective steady annual rate of roughly 20.1% over the five years — even if the actual year-by-year returns looked nothing like a flat 20.1% (perhaps year one returned 40%, year two lost 10%, and so on). The absolute return over the full period, by contrast, is a much simpler calculation: (2,50,000 − 1,00,000) / 1,00,000 = 150%, meaning your money grew by 150% in total — a genuinely different number from the 20.1% CAGR, and one that’s easy to confuse if you’re not careful about which figure a given source is quoting.
Why CAGR ignores the path — and why that matters
Two investments can have the exact same CAGR while feeling completely different to actually hold through the period. One might have grown steadily, gaining roughly the same amount every year; the other might have crashed 40% in year two and then rallied hard to catch up by year five. CAGR treats both scenarios identically because it only cares about the start point and the end point, not the journey in between. This is a genuinely important limitation to understand — CAGR tells you the average annualised outcome, not the emotional or financial experience of the ride you’d have gone through getting there, which matters enormously for your own risk tolerance and behaviour as an investor.
CAGR vs absolute return — the confusion that trips up most people
Absolute return simply tells you the total percentage gain over the whole holding period, with no regard for how long that period actually was. A 100% absolute return sounds identical whether it happened over 3 years or over 15 years, but the CAGR for those two very different scenarios is dramatically different — roughly 26% per year for the 3-year case, versus roughly 4.7% per year for the 15-year case. This is exactly why CAGR, not absolute return, is the correct and standard number to use whenever you’re comparing two investments held for different lengths of time; comparing raw absolute returns across different holding periods is a common and misleading mistake.
CAGR vs XIRR — when CAGR isn’t the right tool
CAGR assumes a single lumpsum investment at the start and a single withdrawal at the end, with nothing added or removed in between. If you’ve made multiple investments at different times — as happens with a SIP, additional lumpsum top-ups, or partial withdrawals along the way — CAGR alone won’t accurately capture your true annualised return, because it can’t account for money entering or leaving at different points in time. In those cases, a related but more sophisticated measure called XIRR (Extended Internal Rate of Return) is the more appropriate tool, since it accounts for the exact timing and size of every individual cash flow. If your entire investment history is a single lumpsum in and a single value out, CAGR (as calculated by this calculator) is exactly the right tool; for anything involving multiple cash flows over time, XIRR is the more accurate measure to use instead.
Where CAGR is genuinely and widely useful
CAGR is the right tool for comparing two different funds or asset classes over the same holding period, checking whether a specific investment beat inflation on a fair, annualised basis, or evaluating how a business’s revenue, profit, or a stock’s price has grown year over year across multi-year periods. It’s used constantly in mutual fund fact sheets (where trailing 1-year, 3-year, and 5-year CAGR figures are standard disclosures), business annual reports, and investment pitch decks — precisely because it strips out the noise of individual year-to-year fluctuations and gives a single, comparable growth figure.
Using CAGR to reverse-engineer a target
CAGR can also be used in reverse to sanity-check a financial goal. If you want to know what average annual return you’d need to turn a specific starting amount into a specific target amount over a given number of years, you can enter your desired starting value, target ending value, and time horizon into this calculator to see the implied CAGR required — and then judge for yourself whether that required rate is realistic given historical returns for the asset class you’re considering. A goal that implies a 25%+ CAGR sustained over 15+ years, for instance, is considerably more aggressive than most diversified equity portfolios have historically delivered, which is valuable information before anchoring a financial plan on that assumption.
A word of caution on CAGR and risk
Because CAGR smooths volatility entirely out of the picture, it should never be the only number you look at before investing — especially for equity investments, where the actual path taken matters enormously both for your own psychological risk tolerance and for the specific timing of when you might need to withdraw the money. A high historical CAGR calculated over a fortunate multi-year window doesn’t guarantee similar smoothness (or even a similar rate) going forward. Pair any CAGR figure you calculate or encounter with some understanding of the investment’s underlying volatility, not just its clean, smoothed-out endpoint-to-endpoint growth number.
Who should use this calculator
Investors comparing two or more funds or stocks over the same period, business owners or analysts tracking year-over-year revenue or profit growth, or anyone who wants to convert a simple “before and after” number they’ve encountered into a meaningful, comparable annualised rate will find this calculator directly useful.
Frequently asked questions
Is a higher CAGR always better? Generally yes when comparing similar-risk investments over the same period, but a higher CAGR often comes with higher volatility or risk — always weigh CAGR alongside the investment’s risk profile, not in isolation.
Can CAGR be negative? Yes — if your ending value is lower than your starting value, the CAGR calculation will produce a negative percentage, correctly reflecting an overall loss over the period, annualised.
Why does my broker’s app show a different return figure from what this calculator gives? Your broker may be showing XIRR (which accounts for multiple cash flows over time) rather than CAGR (which assumes a single lumpsum in and out) — the two measure related but different things, and will diverge whenever more than one transaction occurred during the holding period.
What’s a “good” CAGR for Indian equity mutual funds? Long-term (10+ year) CAGR for diversified Indian equity funds has historically often fallen somewhere in the 10-15% range, though this varies significantly by fund, time period measured, and market conditions during that specific window.
Try it now
Open the CAGR Calculator on AliGreat.com, enter your start and end values, and get your annualised growth rate instantly — free and formula-transparent.